Lesson 1: Creating Apps Without Programming
- Lesson One Web App - ESRI Web App Builder

This lesson explored the codeless mapping solutions that are available from within the ESRI ecosystem. Throughout the lesson we learned how to use the ArcGIS portal web maps and how to create and style web applications from them.
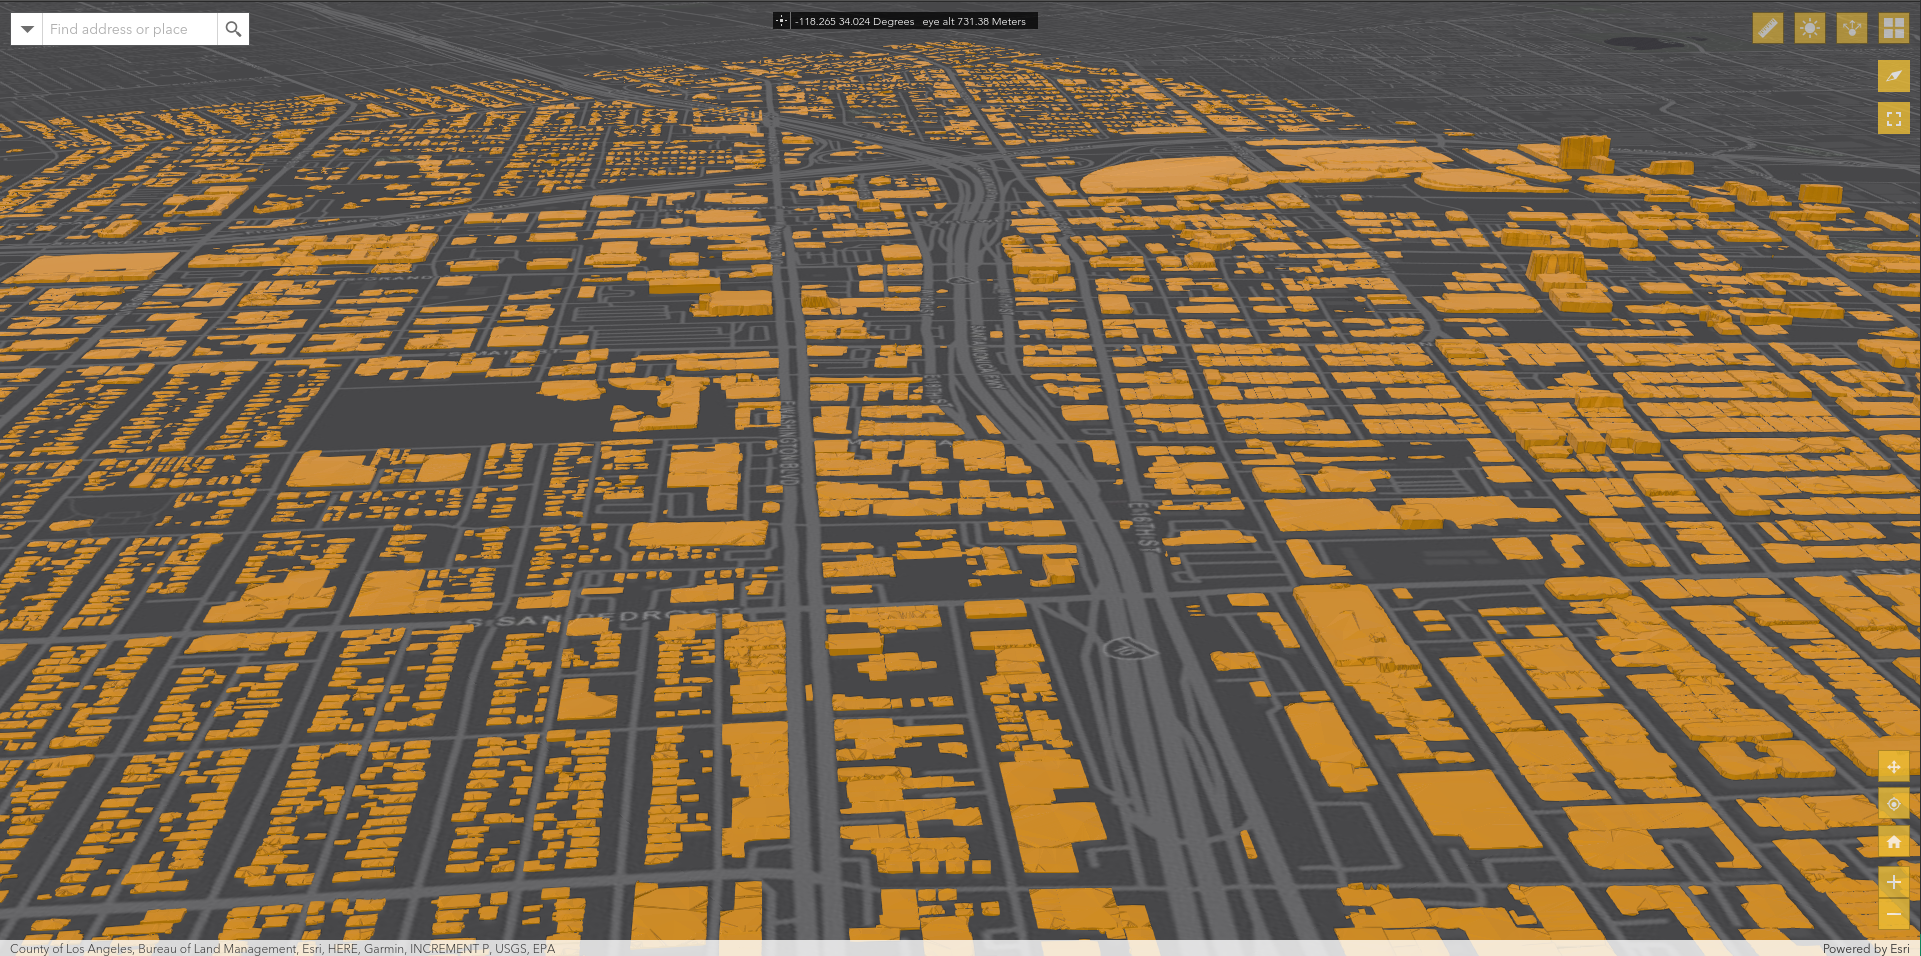
For my Lesson assignment I choose to employ the 3D building data in Los Angeles that I had created during my final project for GEOG: 485. The web app builder configuration options for web scenes is much slimmer than what is available for regular 2D web maps. As such the only custom widgets in the scene are a Basemap Selector (which doesn’t support removing specific basemaps), the measure tool, and a daylight shadows tool. The web scene interface also differs greatly from the web map interface, supporting fewer features like labeling or the pop-up configuration.
Lesson 2: Web Publishing (HTML/XHTML/CSS)
- Lesson Two Project - XHTML/CSS Web Page
This lesson served as an introduction/reminder on the syntax and core elements of HTML and CSS languages.
Lesson 3: ArcGIS API for JavaScript Introduction
- Lesson 3 Part 1 - Hometown Marker
- Lesson 3 Part 2 - Graphic Attribute Popup
See the Pen Cleveland, OH Map by GeoGalvanic (@geogalvanic) on CodePen.
This lesson was a good refresher on the syntax used by JavaScript, especially after using python almost exclusively over the last year. In particular I was paying attention to the variable, function, loop and class definitions/declarations which differ slightly from python but retain most of the same functionality. It was also a good opportunity to re-familiarize myself with the JS API Reference documentation, which has changed it’s UI slightly since I last used it. The implementation of the lesson assignments was pretty straightforward and accomplished without issue. One of the things I had forgotten about the JS API was the limited number of style types available within the SimpleMarkerSymbol class, especially when compared with the extensive symbology options I’ve been getting used to in desktop ArcGIS Pro. Originally I wanted to make the symbol a star, however this seems that it would require either using a PictureMarkerSymbol (which would also require creating images for each color if I later wanted to use it in a unique value or class breaks renderer) or to use a TextSymbol and a star character (★) in the text, which I’m not entirely certain will work or be consistent across client platforms.
This lesson also presented me with a difficult challenge in having to select only one hometown, as in reality I actually have many hometowns. This prompted me to extend the lesson with the below where I use OOP practices I learned from GEOG 489 to create a list of city objects representing my collection of hometowns and add them as graphics to the map with a loop. This approach also required calculating an extent based on the hometown list, rather than centering the map on a single point.
- Lesson 3 Part X(tra) - Multiple Town Markers
Lesson 4: Adding Layers
This lesson showed how to add new layers from ESRI's ecosystem into web apps created from the JS API. The lesson covered the different types of Geospatial web layers, navigating through ESRI's REST API, and covered some coding fundamentals such as debugging and autocasting.
The primary assignments for this lesson were to create web apps utilizing different types of layers. Part of the core requirements for this task were being able to find the layers from ArcGIS Online on our own, as such we were asked not to share these assignments on our portfolios, in order to not give away the answer to future classes.
The final component of this lesson was to create a video investigating the qualities of an IDE, for which I decided to explore KDE's Kate.
Lesson 5: Layer Visualization

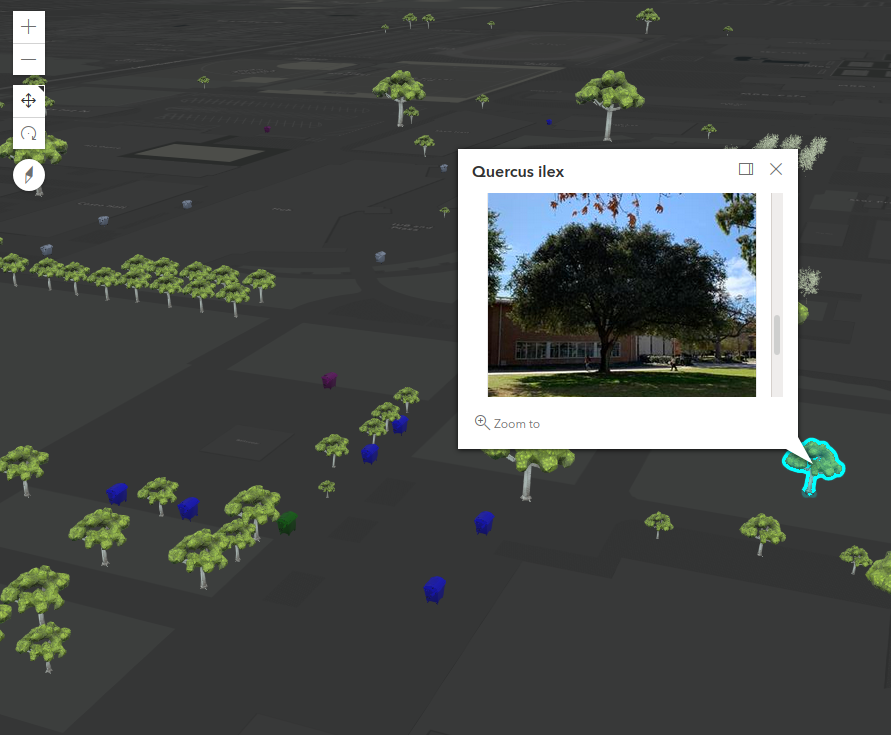
When starting this assignment I decided that I wanted to create a semi-realistic thematic scene using 3D object models. I found some feature layers representing real world objects on the UCR campus and then downloaded some free 3D GLTF models to represent those objects.
The first thing I attempted to do in this project was extend the ArcGIS API classes. Through much experimentation I was able to accomplish this by using the Accessor class. I ended up extending the Object3DSymbol layer in order to simplify using GLTF models as the resource type.
When adding reclying bins I decided to use a UniqueValuesRenderer which would change the color of the model depending on the bin type. For the pop-ups I decided to use text content which shows only fields that are not empty.
For the trees layer I again used a unique value renderer, this time changing the model rather than the color depending on the type of tree. I also employed the use of visual variables in order to change the height of the trees. For the popups on this layer I simply made use of the attachments content.
Lesson 6: Search and Query Capability

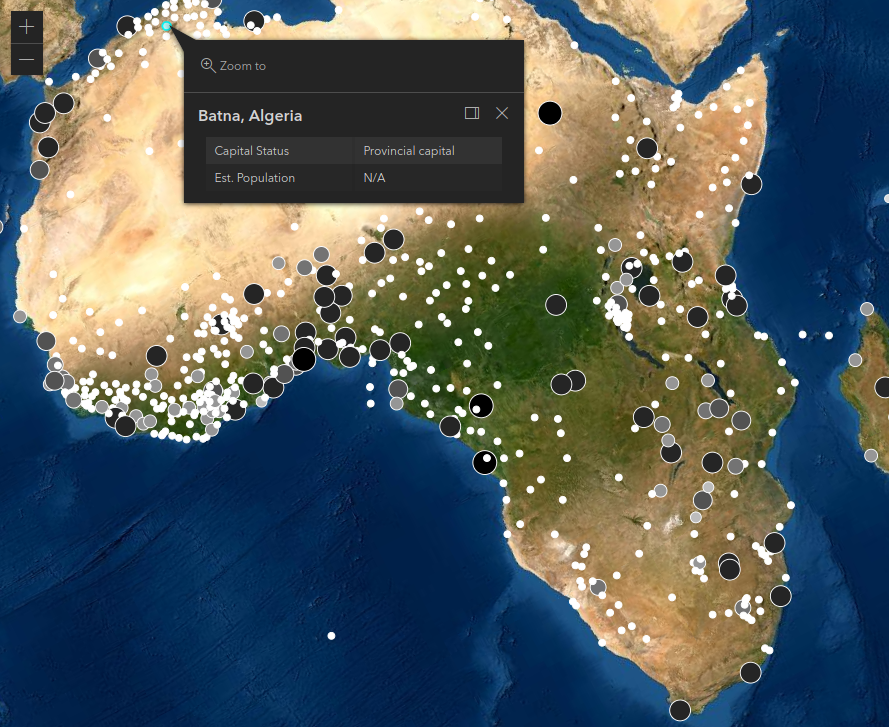
This map will display a window prompt asking the user to input the name of a continent. Behind the scenes the application will then query an ArcGIS Online continents feature service to get the geometry for the continent in order to perform a spatial query on a world cities feature service. The world cities which are returned from the query are symbolized according to the population size using a UniqueValuesRenderer. Once the world cities are loaded onto the map the view will pan and zoom to encompass those cities. An additional feature to this map is that it will verify your input to make sure you enter the name of a real continent. If the user fails to enter a valid input a prompt will displayed reminding the user of continent names.
Lesson 7: User Interface Development

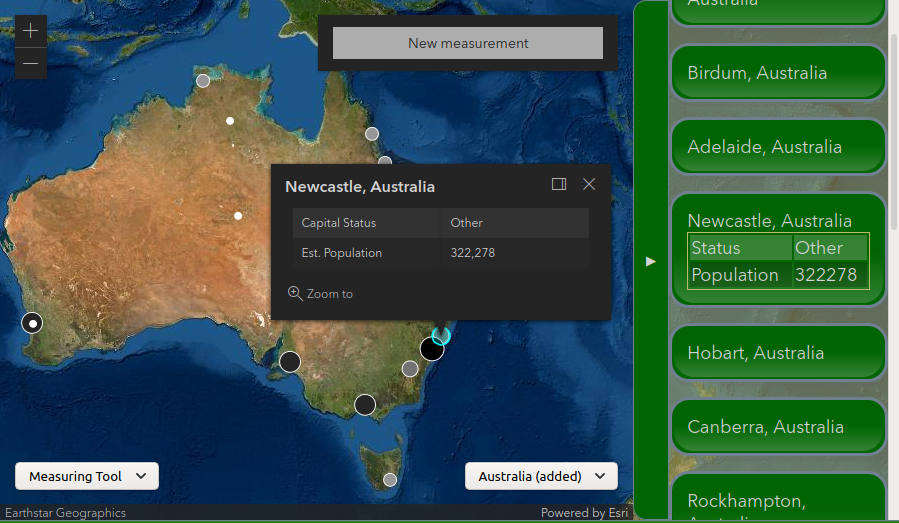
This project worked on and refined the previous one by adding user interface elements. The main behaviors I was aiming for in this design revolved around the implementation of the sidebar. I wanted to ensure that the sidebar would not cover UI elements, could be closed or expaned to a size dependent on the size of the view, and also included in the frame of the map. In order to achieve this effect I had to modify the DOM elements that were created by the ESRI JS API to make sure the default UI elements would grow/shrink with the newly added sidebar. In order to implement interactivity for the sidebar I employed an object based approach in order to link the html elements with their Graphics instances. The other two main UI elements are selectors at the bottom of the map, a widget selector that changes the widget in the top right and a query selector that drives the query elements from the previous lesson.
Final Project: Client Side Feature Editor
This project mainly makes use of the experimental File Access System API available in Chrome/Chromium browsers that provides JS applications access to files on the clients local machine without needing to prompt the user to download and upload files. The application makes use of a "project" directory structure in order to allow users to keep track data edits.
